3D visualization (ArtiaX)
nextPYP produces all the necessary files to visualize a refined structure mapped back into the original tomograms using the ArtiaX plugin for ChimeraX.
Download files
First, you need to download the following files to your local computer:
Tomogram reconstruction (
*.rec)Refined map (
*.mrc)Corresponding particle orientations (
*.star)
You can get these files from nextPYP as follows:
Go to the Pre-processing` block, click on the Tilt-series tab, select a tilt-series using the navigation bar and go to the Tomogram section. Download the
.recfile by clicking on the gray/green badgeGo to the Particle refinement block, select the Reconstruction tab and download the
Cropped Mapusing the dropdown menuIn the same Particle refinement block, go the Metadata tab, type the name of the tilt-series in the box and click Search. Download the corresponding
.starfile by clicking on the gray/green badge
Display in ChimeraX
Open ChimeraX (we assume the ArtiaX plugin is already installed)
Open the tomogram file
tilt_series_name.rec- Run the following commands in the ChimeraX shell:
volume permuteAxes #1 xzyvolume flip #2 axis z
Go to the ArtiaX tab and
Launchthe pluginIn the Tomograms section (main ArtiaX panel on the left), select model #3 (permuted z flip) from the
Add Modeldropdown menu and clickAdd!Go to to the ArtiaX options panel on the right, and set the
Pixel Sizefor the Current Tomogram to the binned pixel size (10.8 for the EMPIAR-10164 tutorial) and clickApplyFrom the Particles List section (main ArtiaX panel on the left), select
Open List ...and browse to the location of the.starfileGo to the ArtiaX options panel on the right, select the Select/Manipulate tab and set the
Originof thePixelsize Factorsto the unbinned pixel size of the data (1.35 for the EMPIAR-10164 tutorial)From the Geometric Models section (main ArtiaX panel on the left), go to
Open Geomodel ...and select the refined mapGo to the ArtiaX options panel on the right, in the Visualization tab, set the
Use Modelfrom the dropdown menu to the refined map and clickAttach ModelFrom the Color Settings section, select
Colormapand choose the attributerlnLogLikelihoodContributionfrom the dropdown menu
If everything went well, you should obtain a result similar to this:
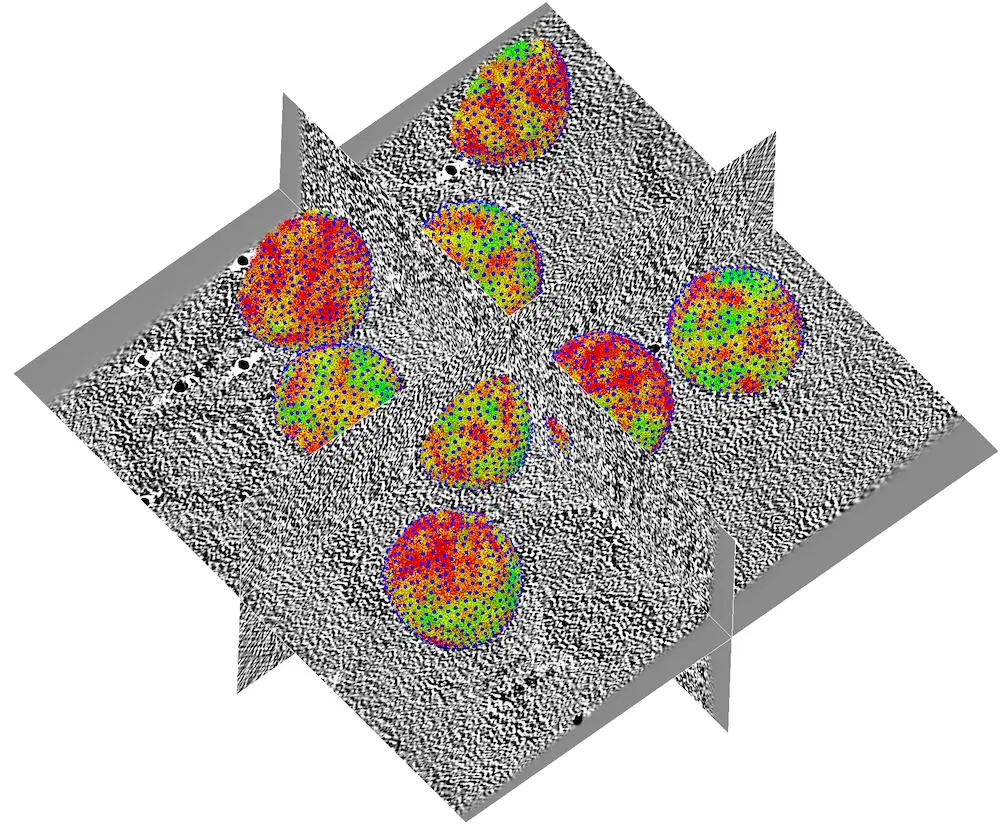
Tomogram from immature HIV-1 virions from EMPIAR-10164 showing with a high-resolution model of Gag mapped back into the tomogram.
Tip
Repeating this process for other tilt-series in the dataset is usually a good idea
Depending on the dimensions of the refined map and the number of particles in the tomogram, you may need to downsample the map to make ChimeraX more responsive