Visualizing 3D Results in Phoenix 🐦🔥
1. Prepare Real-Domain Visualization
These instructions assume inference results from real-domain inputs.
Copy output files to your local machine:
cp output_dir/real/inference/data_for_export.parquet.zip real/
cp output_dir/real/inference/zipped_thumbnail_images.tar.gz real/
Create a folder for the thumbnail images:
Extract thumbnails:
Start a local HTTP server to host thumbnails:
In another terminal, download and launch the visualizer:
wget https://github.com/nextpyp/prismpyp/blob/main/scripts/visualizer.py

python visualizer.py \
   real/data_for_export.parquet.zip \
   --port 5004 \
   --which-embedding umap
Warning
Make sure that the ports used in steps 4 and 5 are identical.
When launched successfully, you’ll see output like:
🌍 To view the Phoenix app in your browser, visit http://localhost:54116/
📺 To view the Phoenix app in a notebook, run `px.active_session().view()`
📖 For more information on how to use Phoenix, check out https://docs.arize.com/phoenix
You can now access the interactive visualization at http://localhost:54116/.
2. Visualize Fourier-Domain Results
You can repeat the same steps for Fourier-domain inputs.
Copy the output files
cp output_dir/fft/inference/data_for_export.parquet.zip fft/
cp output_dir/fft/inference/zipped_thumbnail_images.tar.gz fft/
Create a folder for the thumbnail images
Extract thumbnails:
Start an HTTP server (you can use screen if desired)
Launch the visualization
Expected Results
When you first launch Phoenix, you will be greeted by a landing page like this:
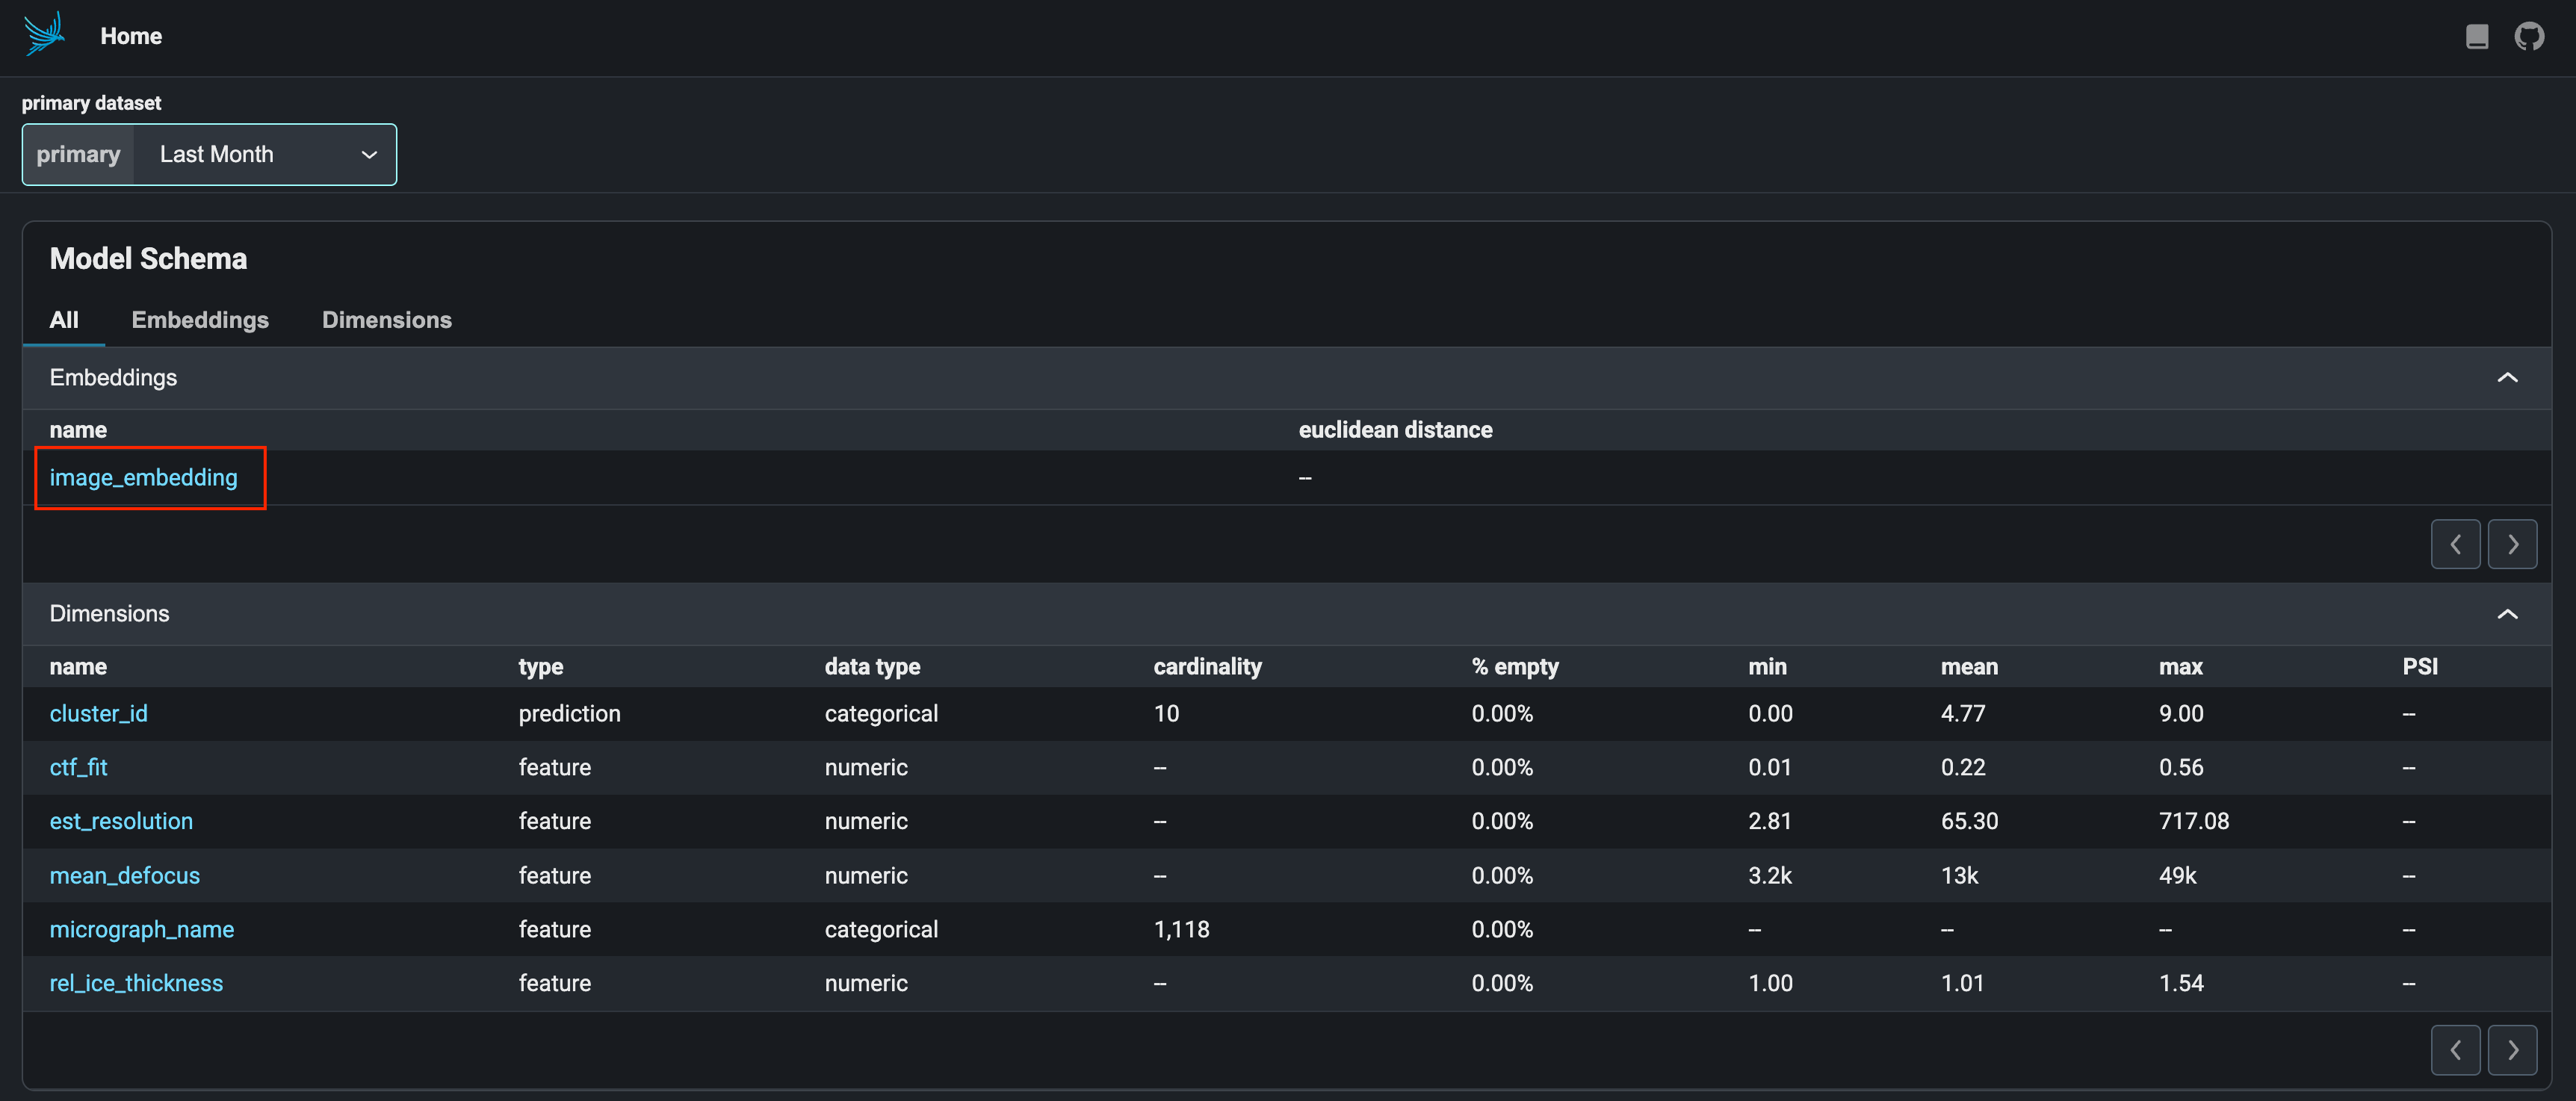
Click on the image_embeddings link (red outline) to load the interactive visualization.
The interactive visualization for this dataset may look as follows:
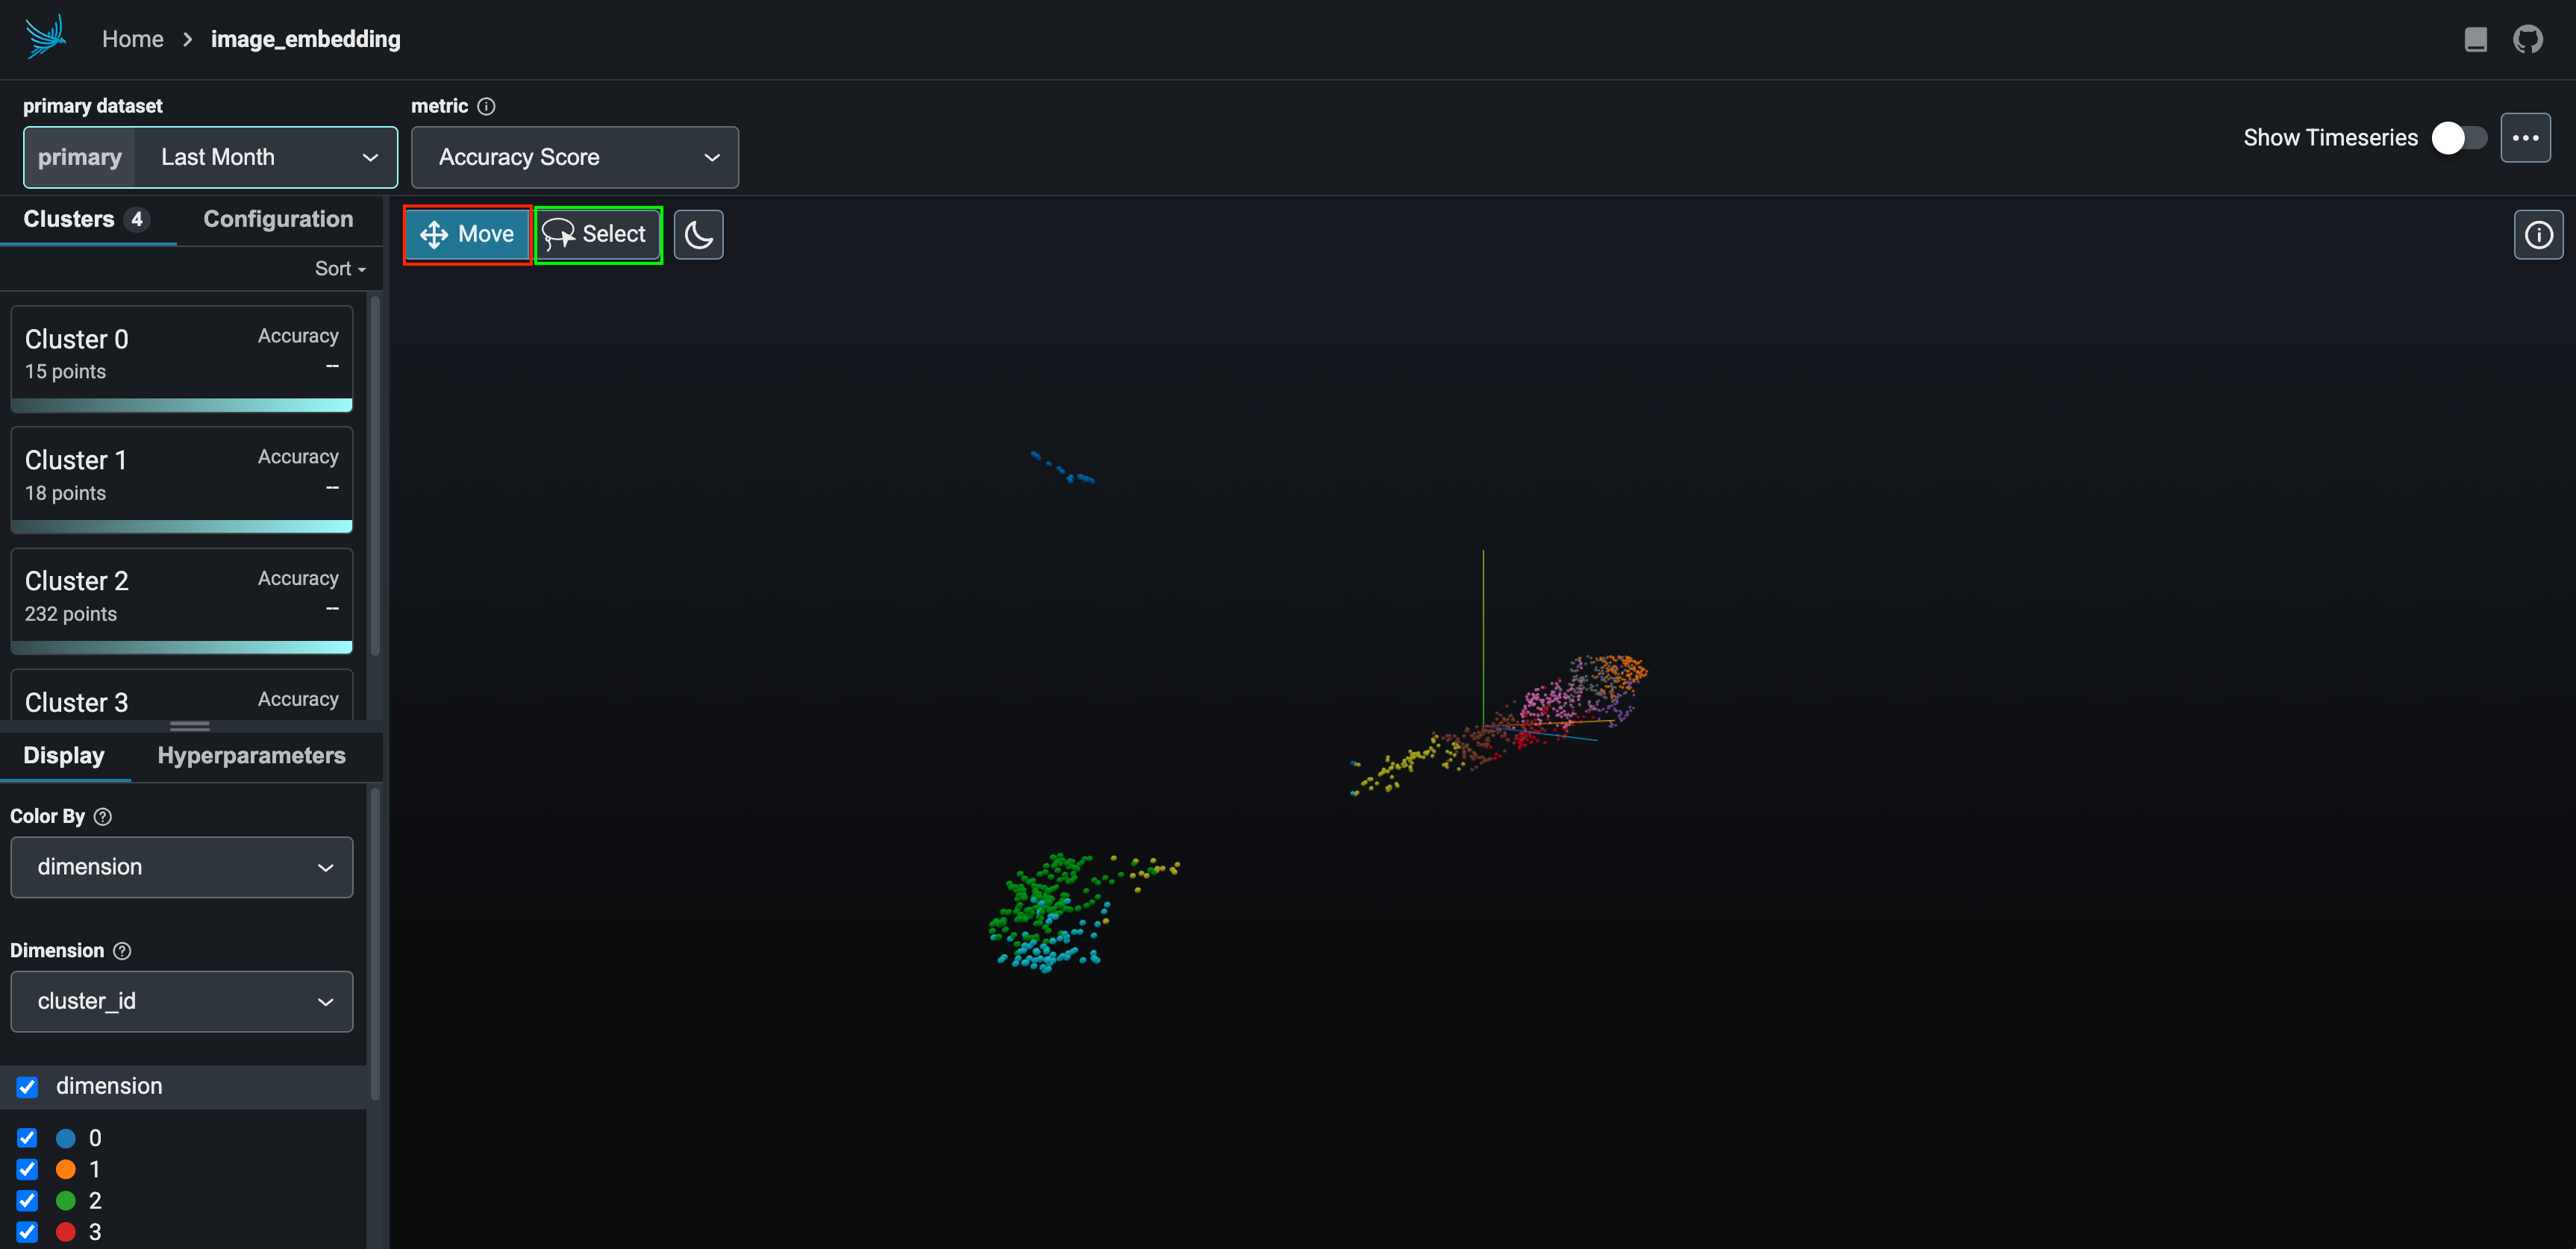
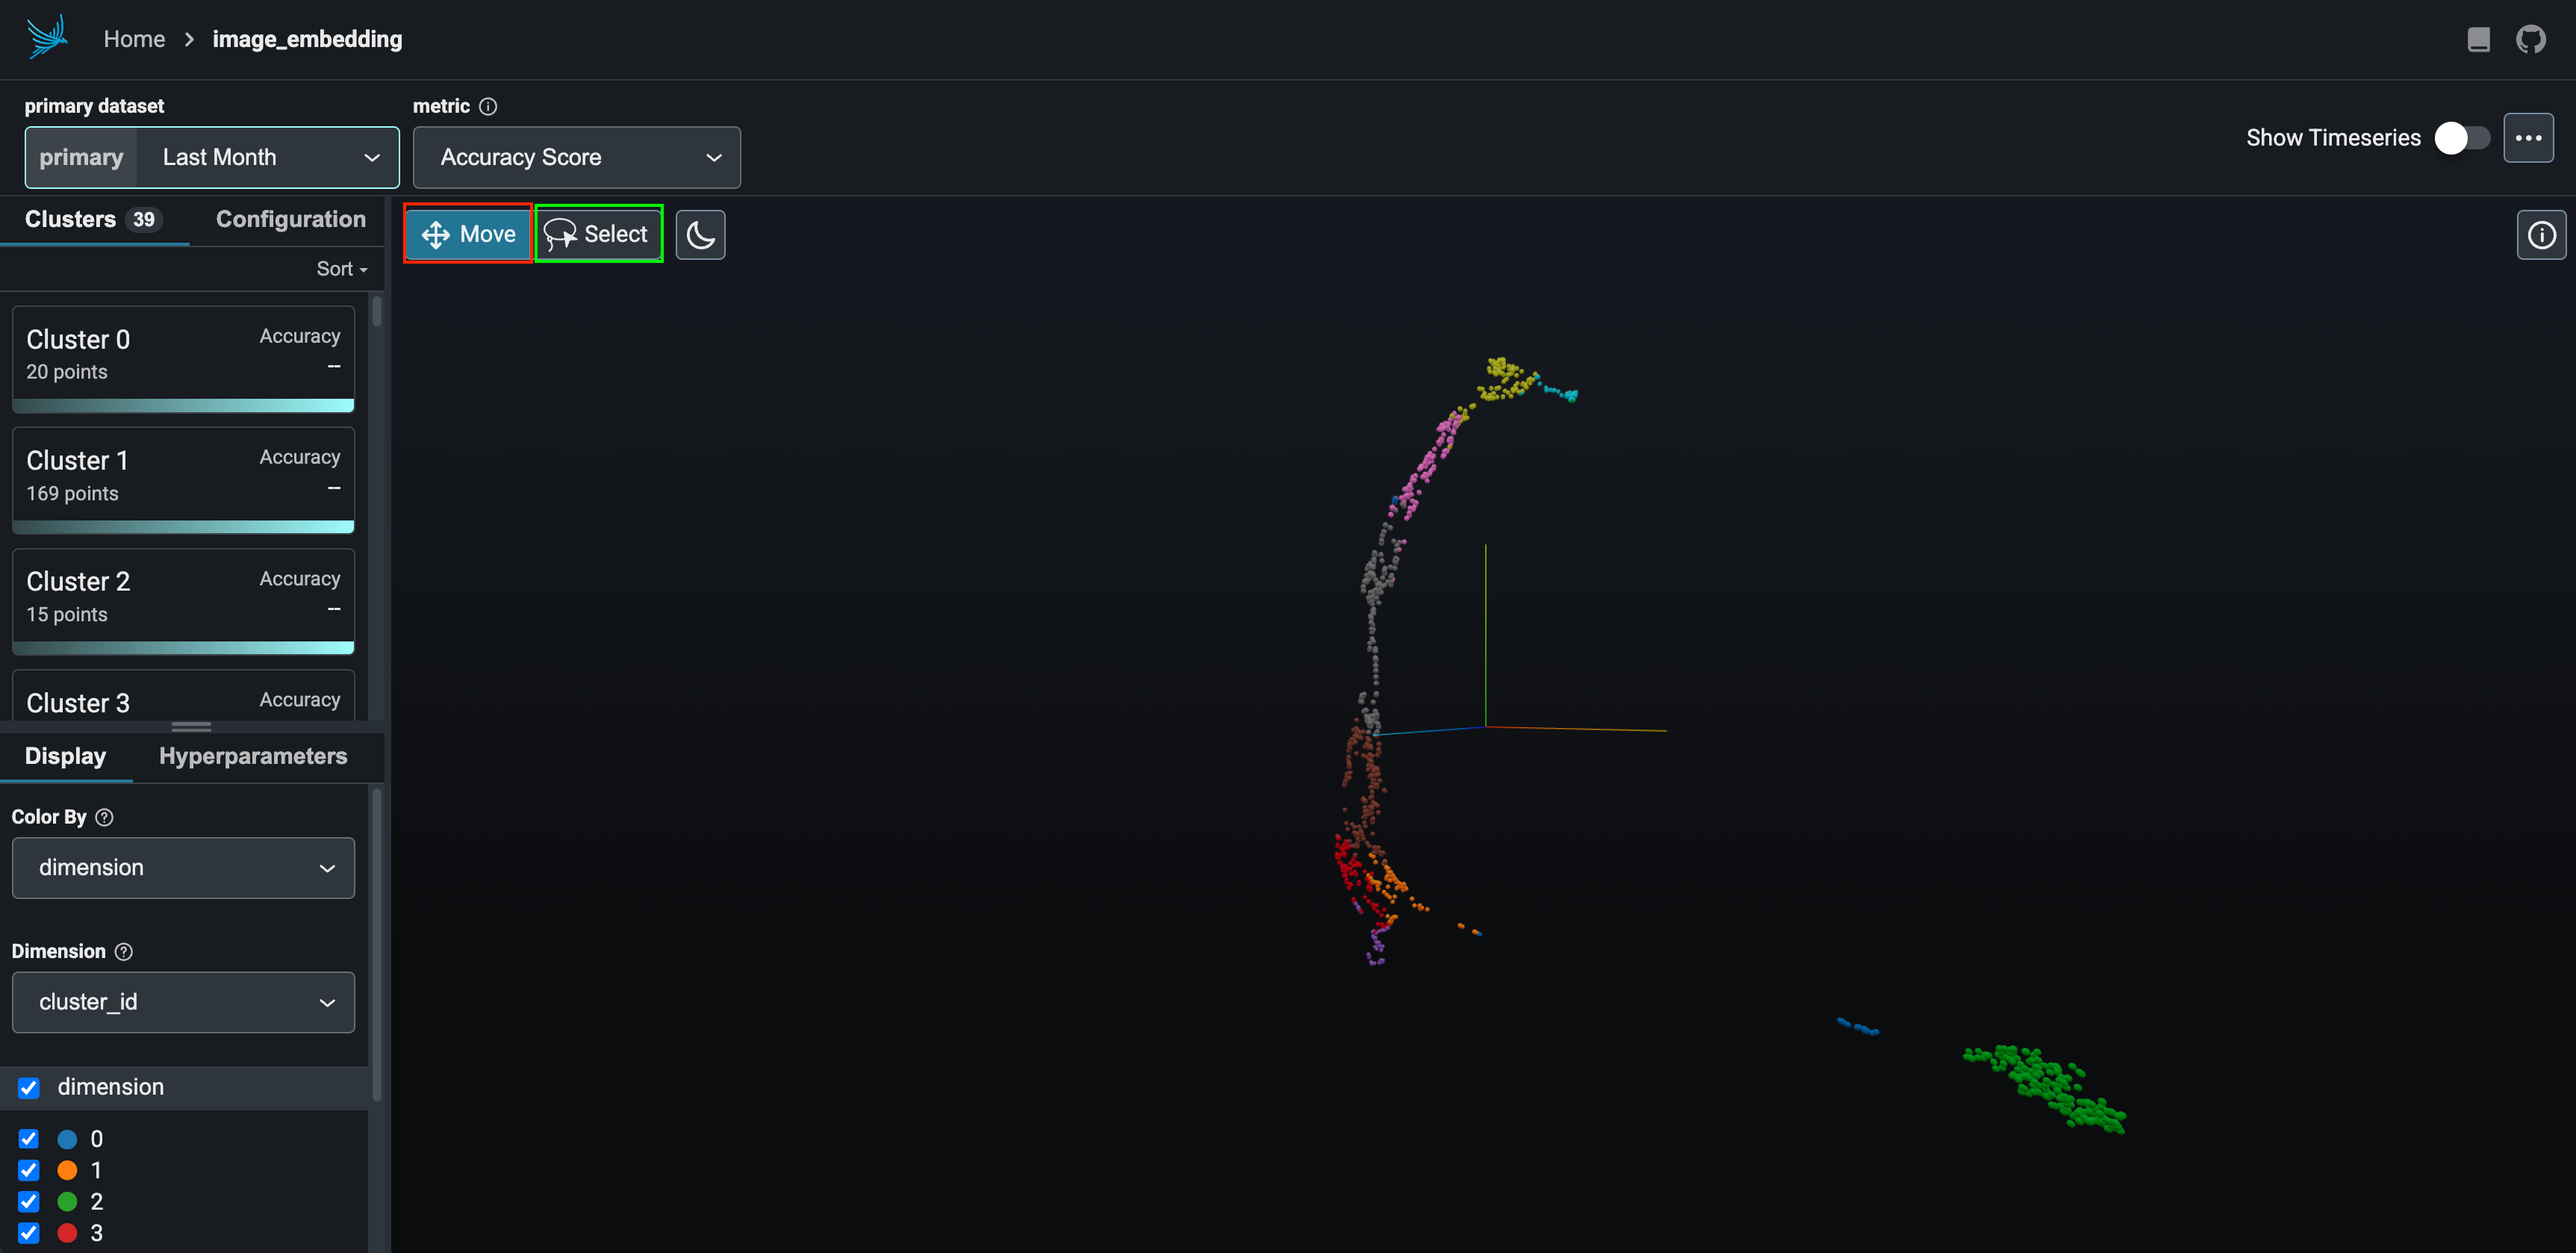
To navigate the embedding space, click on the Move box (red outline) and click and drag your mouse across the screen. When you're ready to make a selection to view/download points, click the Select box (green outline).
The Select box will allow you to view the micrograph and power spectra thumbnails for the selected subset of points. This may look as follows:
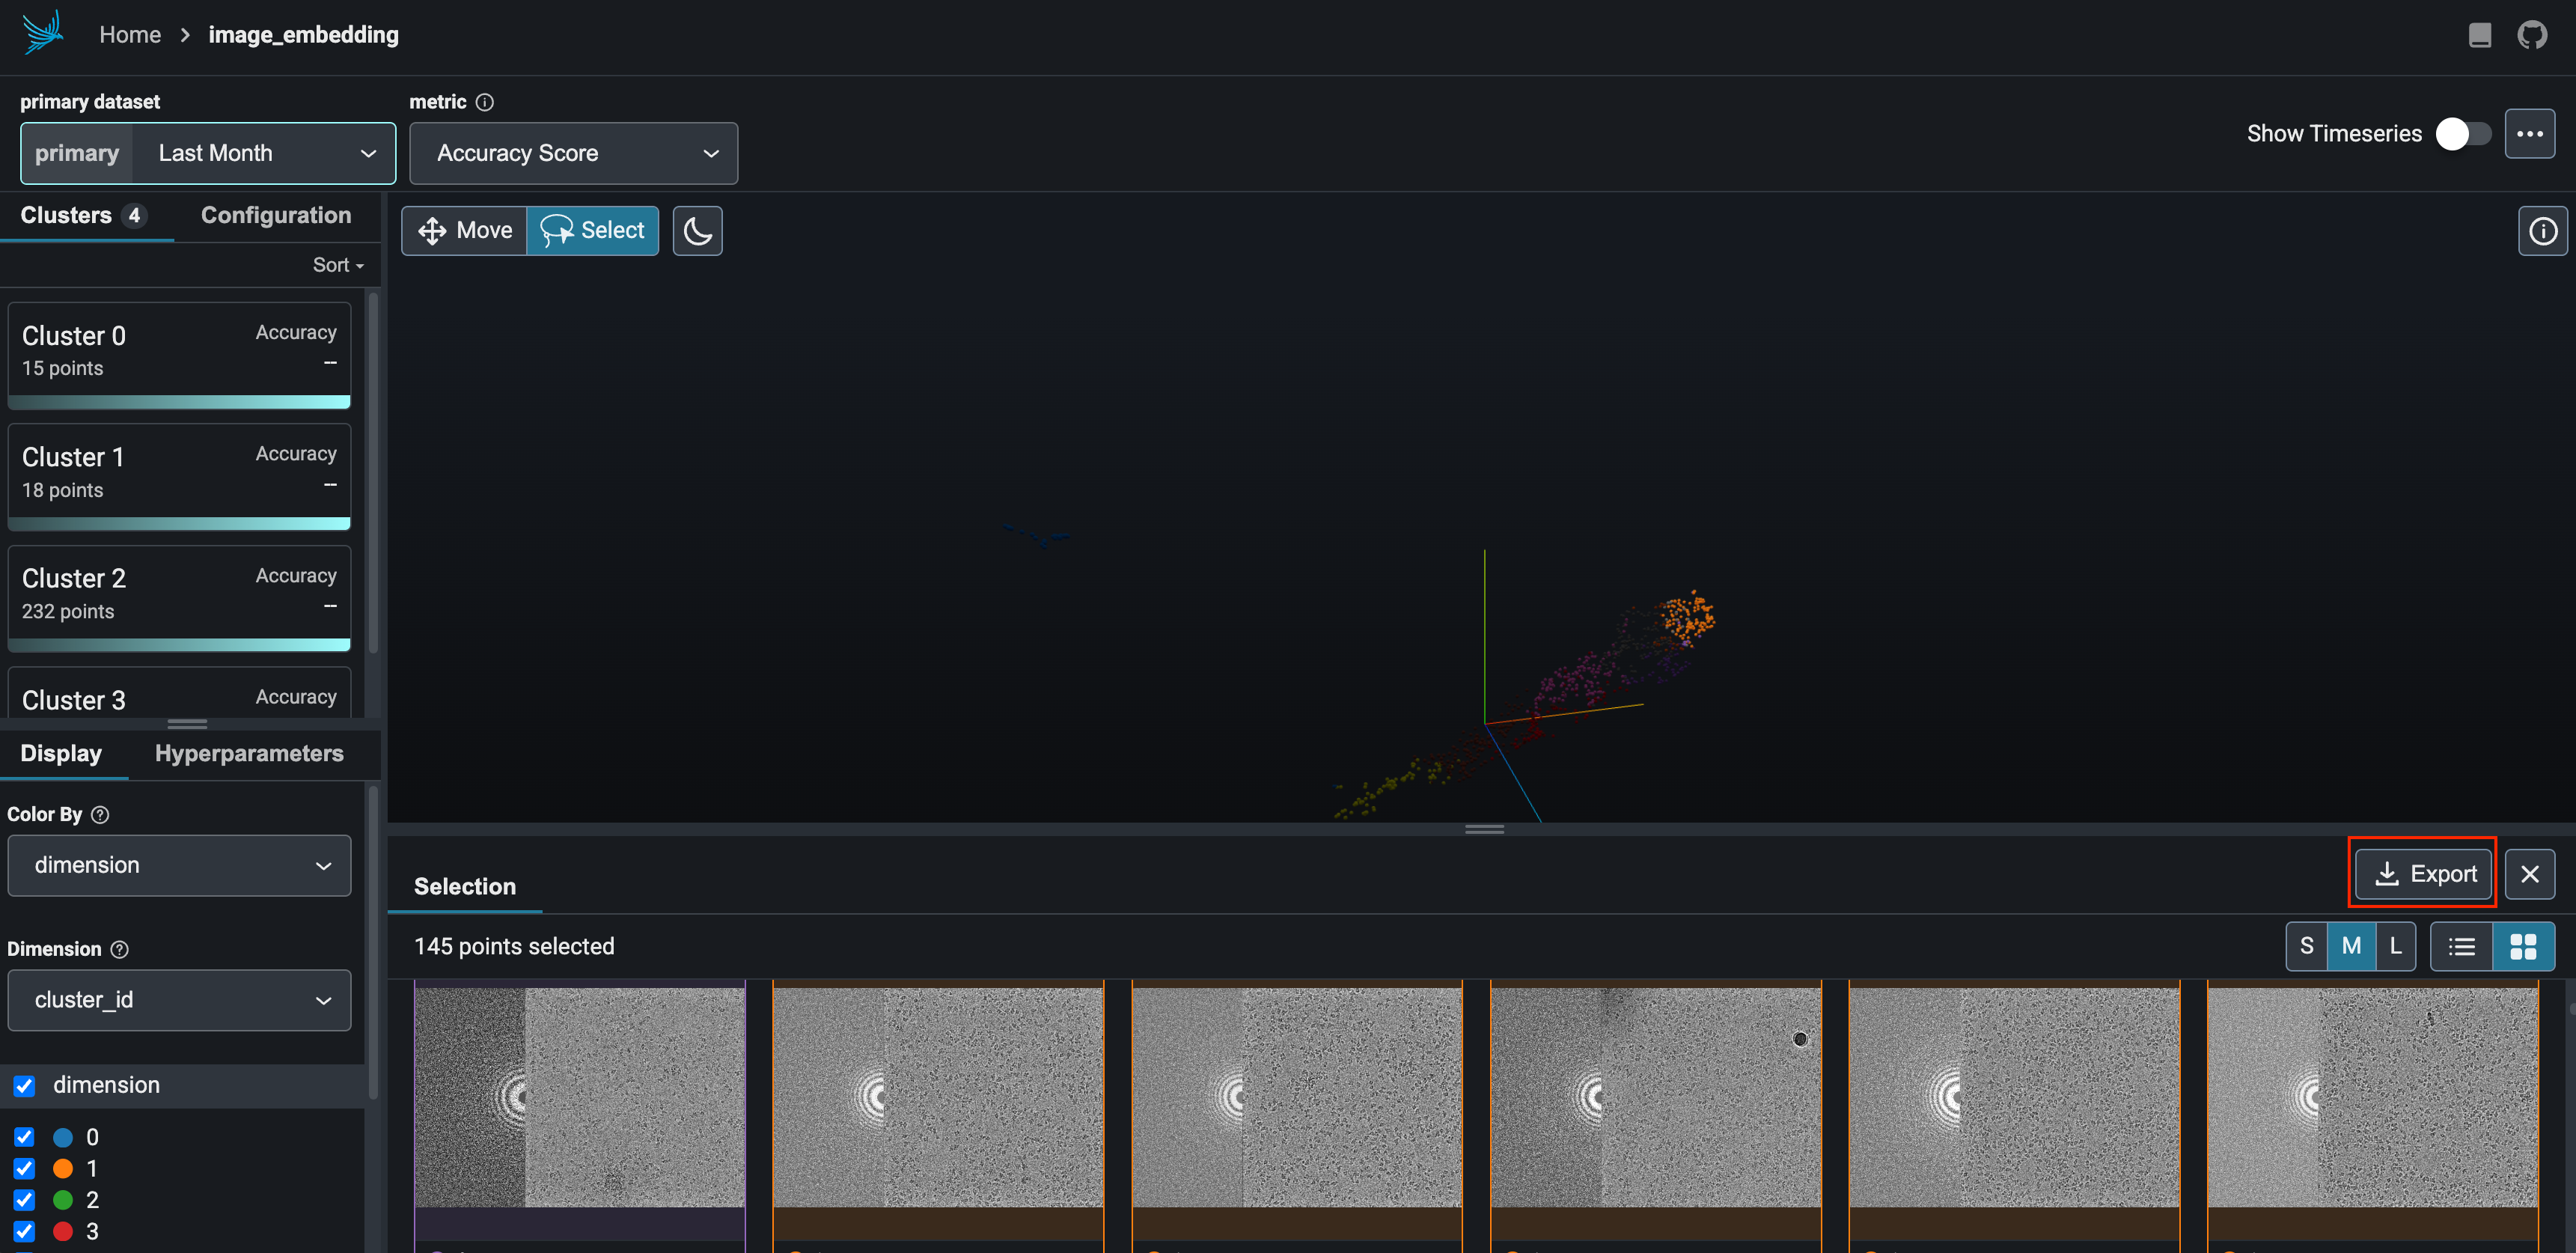
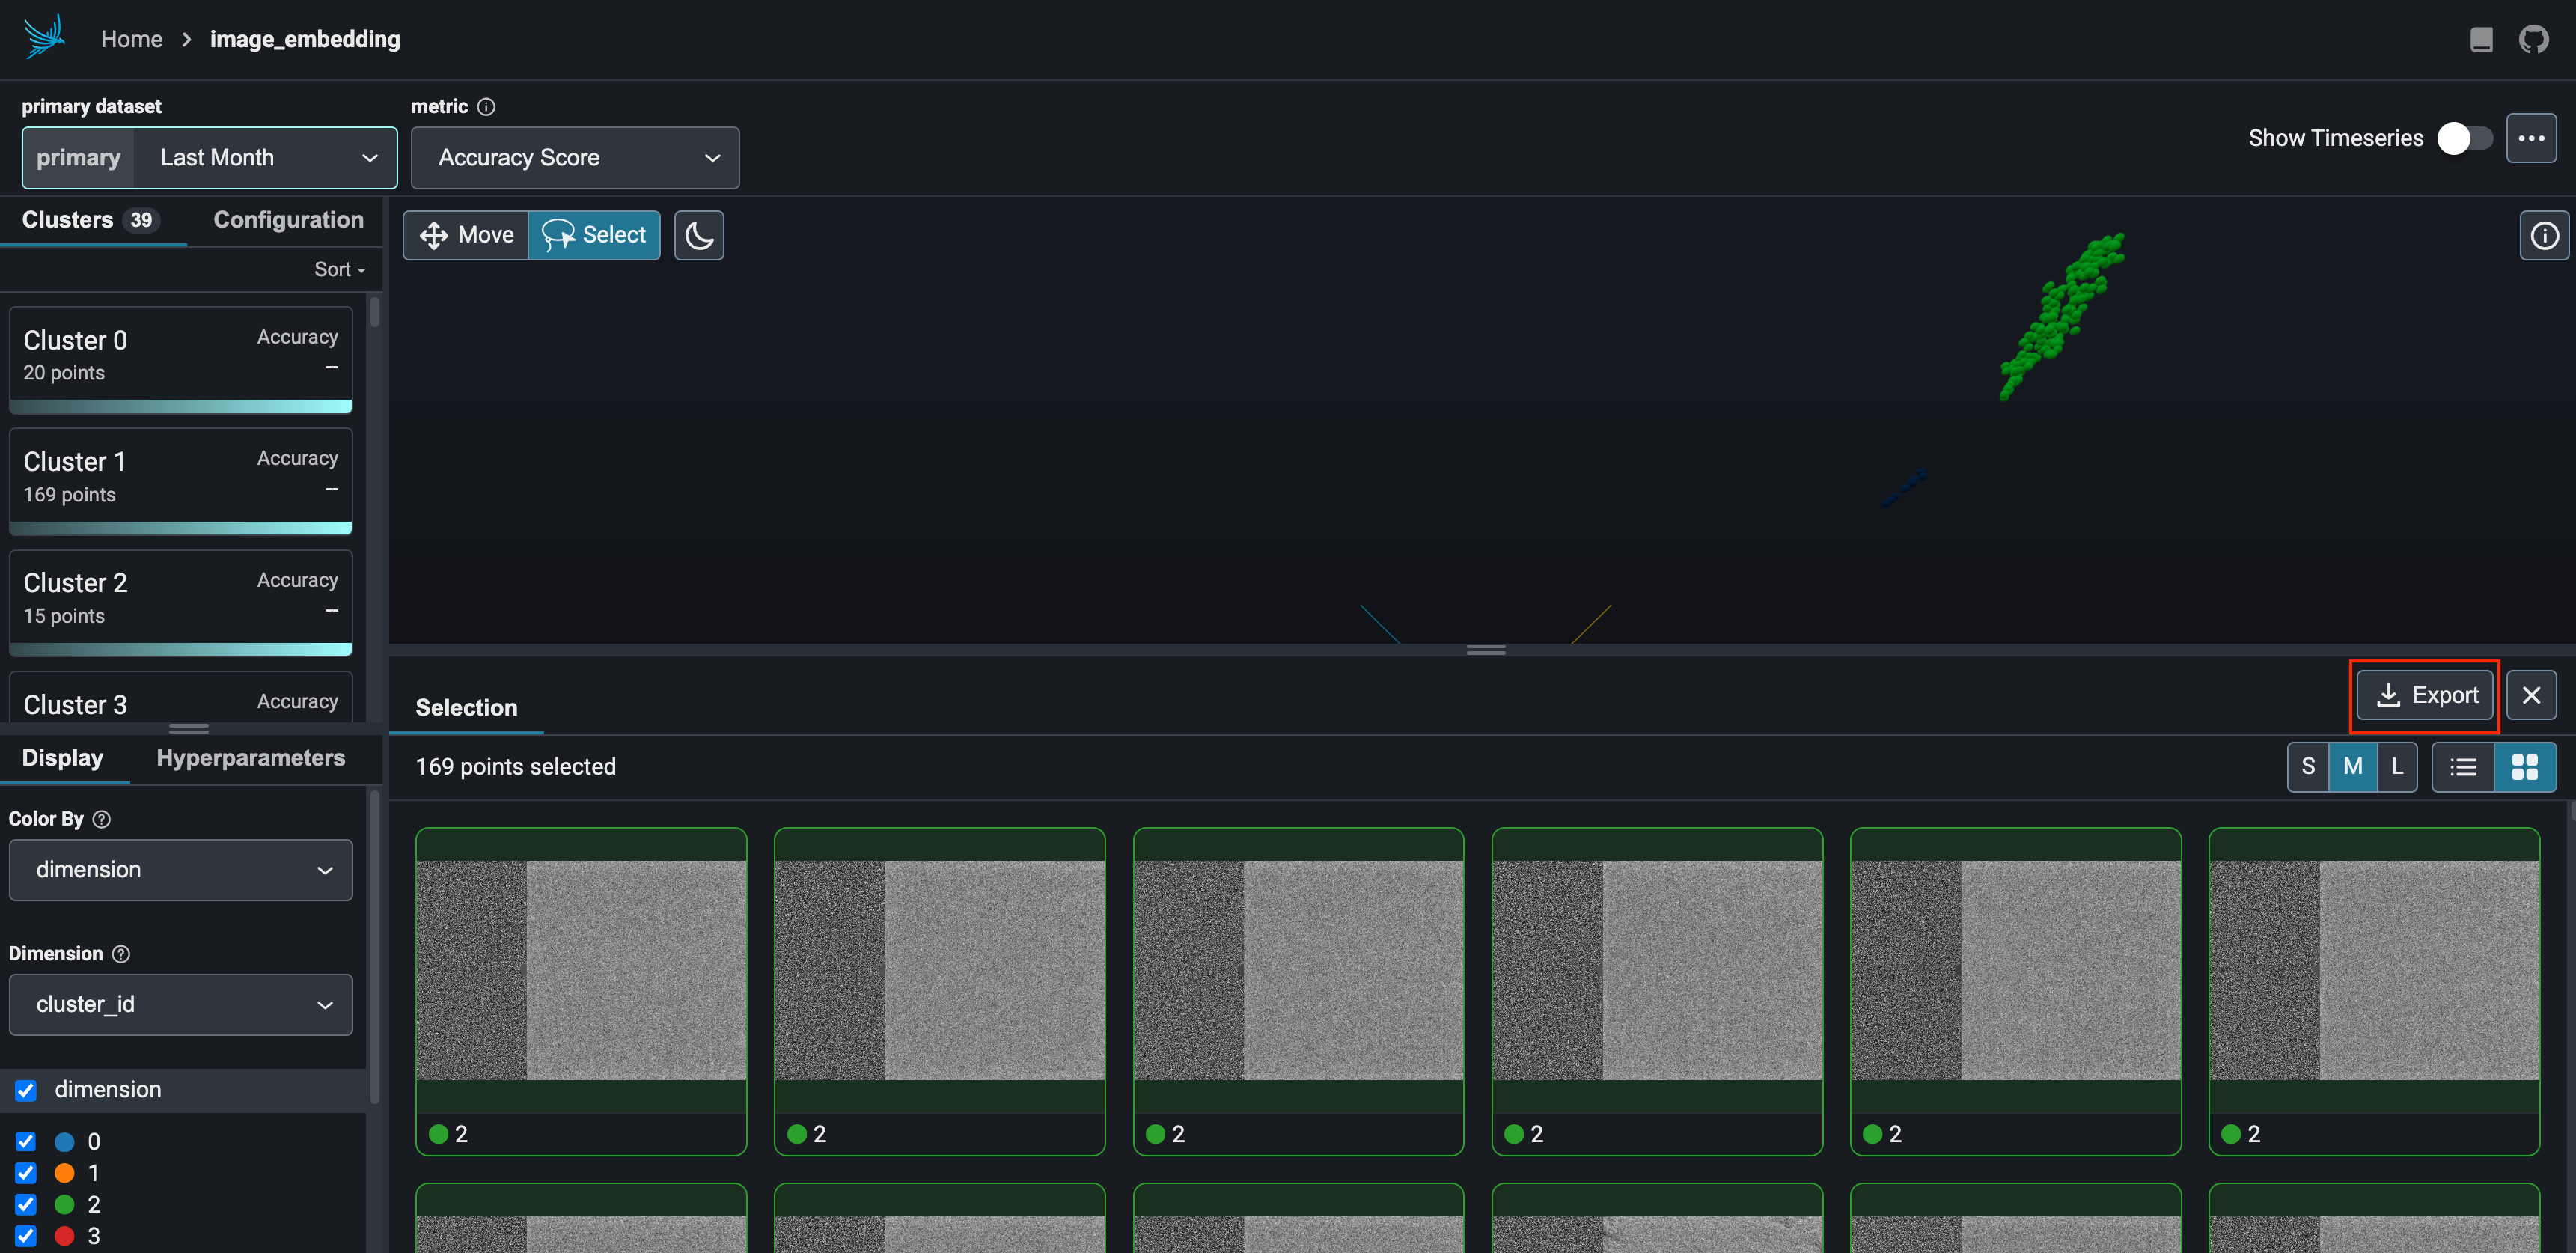
To download the selection as a .parquet file, click on the Export box (red outline).
Lasso Selection and Output
For both domains, interactive lasso selections will be saved as downloadable .parquet files:
| Domain | Output File |
|---|---|
| Real | real/real_good_export.parquet |
| Fourier | fft/fft_good_export.parquet |
These outputs contain the selected subset of high-quality micrographs and can be used for further filtering or downstream processing.